
Analysis without Numbersbright
Products graph

This graph is commonly used for different products purchased. In other words, it identifies the labeled product frequency of an outcome, limiting the segmentation of non-labeled products.
customers graph

I
This distribution graph might show a returning customers' group. But it isn't easy to identify with precision each returning costumers group. Therefore, leading to a misunderstanding of customers' purchases and wrong segmentation.
Affinity graph

The table above shows the affinity product between different items. We can easily identify purchased items together. But for millions of transactions, it isn't easy to make a concise idea about what result and decision to make.
Revenue graph

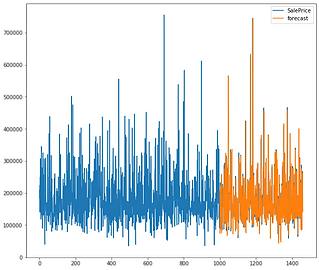
It is a common predictive revenue graph representation that is made on sales estimation through a given period. As we might know any estimation should take into account errors that make a big difference in the forecast.
Numbersbright analysis
We identify products better

Numbersbright identifies clusters with precisions, finding the best cluster useful for product segmentation even if those are not labeled.
we can clearly see which clusters count for segmentation.
We identify customers with precision

Numbersbright identifies the exact number of clusters and shows clearly distinct clusters for better segmentation.
We identify affinity products accurately

We go further than an item table and can work with billions of data displayed in one place helping to get the idea quickly and accurately.
We outperfom forecast revenue

Numbersbright minimizes forecast errors using powerful machine learning tools.
Benefits from Numbersbright analysis.
What makes the difference between general and numbersbright analysis in terms of products or services?
The non-labeled products and precisions are the main difference:
For Wholesales:
- Reach out to buyers.
- Contact your existing customers.
- Run better products promotions.
- Set up a remarkable marketing campaign.
- Get more social media and others' interest.
For retails
- Better target the market identification.
- Review your segment needs and customers behavior.
- Set up accurate products marketing strategies.
- Identify the segment importance.
For services
- Better aggregation of customers with similar wants, needs, and preferences.
- Improve market products grid.
What makes the difference between general and numbersbright analysis in terms of customers?
Distinct customers group with precision is the main difference.
For Wholesales
- Identify which client or retailers' purchase.
- The volume that matters for your business.
- Identify purchase behavior for the future. Marketing strategies.
- It helps to understand psychographic
challenges and a socioeconomic component that has an impact on purchase.
For retails
- It helps determine the way to attract new customers.
- Build a brand loyally.
- Helps to create high or low customer performance.
- Determine how better communicate with customers.
For Services
- Easy way to name your segment.
- Identify your services expectations behavior.
- Create subgroups that apply marketing mix for each of them.
What is the difference between general and numbersbright analysis in terms of affinity products?
The big picture and concise decision-making are the main difference.
For wholesales
- Identify bulk purchases of products sold.
- Increase the accessories products within a low purchase.
For retails
- Identify customers' affinity products.
- Increase products volume sold.
For services
- Identify customer behavior in terms of satisfaction.
- Increases your market share by identifying the target customers.
What makes the difference between general and numbersbright analysis in terms of revenue forecast?
Minimizing errors in revenue forecast is the main difference.
For Wholesales
- Our revenue calculation is based on the forecast that allows visibility in a future perspective by minimizing forecast errors and giving you a chance to have manufacture expenditure under control.
For retails
- It takes the best product, customers segment, and affinity product into account to forecast the most accurate revenue.
For services
- Customer-product perception determines the revenue forecast according to customers' preferences, product purchase behavior, and the relationship.
Something else: We conduct supervised and unsupervised analysis in demand.
supervised

-Linear regression: it establishes a relationship between two or more events of your research.
-Support vector machine: This analysis works for regression and classification and helps you organize your data in a different group for your research.
-Kernel ridge: if your research meets non-linear relations between events but still needs to establish a connection. We use a nonparametric technique to estimate a conditional expectation of a random variable.
-Nearest Neighbors: A quick classification for data with a continuous label. It helps set up categories of the nearest neighbors.
-Decisions tree: Helps you to evaluate different options to take action.
-Naive Bayes: use it for futures event labeled classification. It works well when you need to predict future repetitive outcomes.
-Probability calibration; use it to adjust the probability of given models to reflect the genuine interest better.
-Neural network: it serves for sales forecast, data validation if your research needs to find anomalies or times series predictions.
-Quadratic discriminant analysis: it determines which variables differ from the standard group outcomes.
-Linear discriminant analysis: gives an easy way to manage data by reducing features dimension to make your classifications viable.
unsupervised

-Clustering: you can regroup unlabeled similar traits or data points in a larger group without outcomes concerns. That helps to identify the number of different groups you should manage in your research.
-Biclustering: allow to work simultaneously with two unlabeled data to determine the proper solution.
-covariance estimation: it may be interesting for your research if this aims to evaluate how vital are variables relationship of outcomes.
Density estimation helps you identify if expected outcomes are observed or come with outliers if needed to be removed from your research.
-Neural network models: it helps you recognize objects in research.


